13 Dates and times
本章主要学习使用lubridate处理日期时间类型的数据。
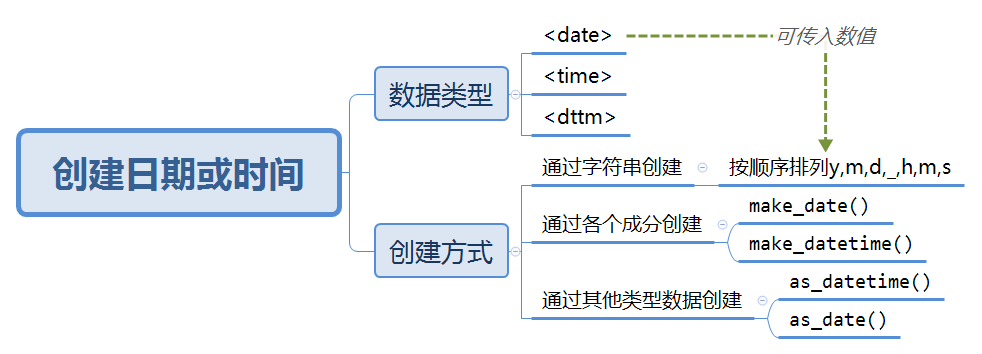
13.1 创建日期或时间
13.1.1 导图
13.1.2 处理flights日期时间数据
make_datetime_100 <- function(year, month, day, time) {
  make_datetime(year, month, day, time %/% 100, time %% 100)
}

flights_dt <- flights %>%
  filter(!is.na(dep_time), !is.na(arr_time)) %>%
  mutate(
    dep_time = make_datetime_100(year, month, day, dep_time),
    arr_time = make_datetime_100(year, month, day, arr_time),
    sched_dep_time = make_datetime_100(
      year, month, day, sched_dep_time
    ),
    sched_arr_time = make_datetime_100(
      year, month, day, sched_arr_time
    )
  ) %>%
  select(origin, dest, ends_with("delay"), ends_with("time"))

flights_dt
#> # A tibble: 328,063 x 9
#>   origin dest  dep_delay arr_delay dep_time            sched_dep_time
#>   <chr>  <chr>     <dbl>     <dbl> <dttm>              <dttm>
#> 1 EWR    IAH           2        11 2013-01-01 05:17:00 2013-01-01 05:15:00
#> 2 LGA    IAH           4        20 2013-01-01 05:33:00 2013-01-01 05:29:00
#> 3 JFK    MIA           2        33 2013-01-01 05:42:00 2013-01-01 05:40:00
#> 4 JFK    BQN          -1       -18 2013-01-01 05:44:00 2013-01-01 05:45:00
#> 5 LGA    ATL          -6       -25 2013-01-01 05:54:00 2013-01-01 06:00:00
#> 6 EWR    ORD          -4        12 2013-01-01 05:54:00 2013-01-01 05:58:00
#> # ... with 328,057 more rows, and 3 more variables: arr_time <dttm>,
#> #   sched_arr_time <dttm>, air_time <dbl>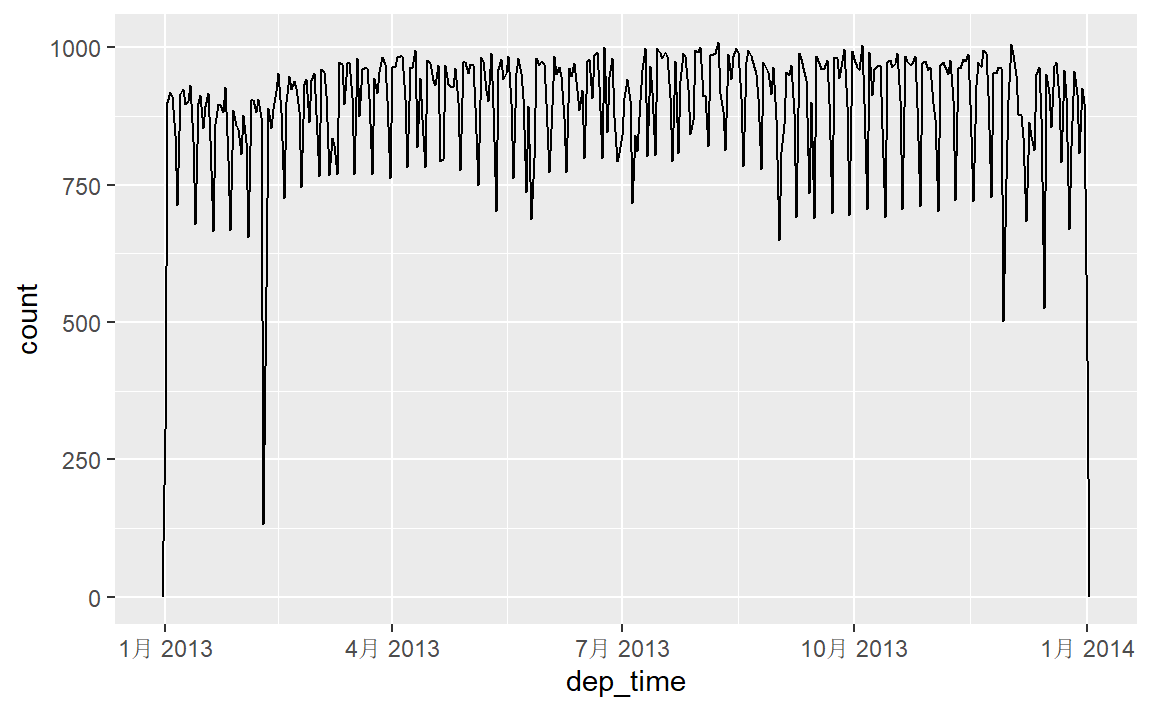
13.2 日期时间成分
13.2.1 导图
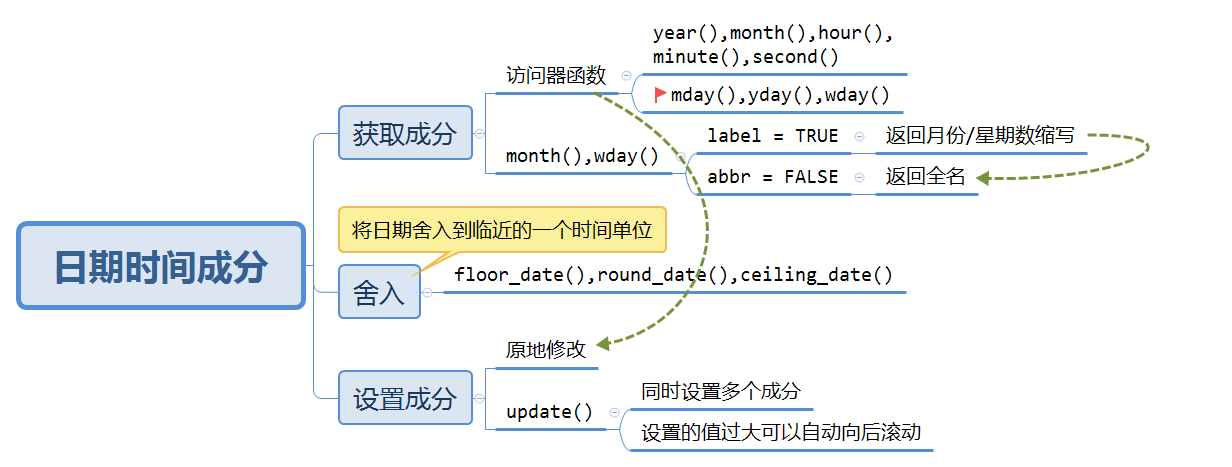
13.2.2 获取day成分
提供了三个访问器函数,mday()(一个月中的第几天)、yday()(一年中的第几天)、wday()(一周中的第几天)。
13.3 时间间隔
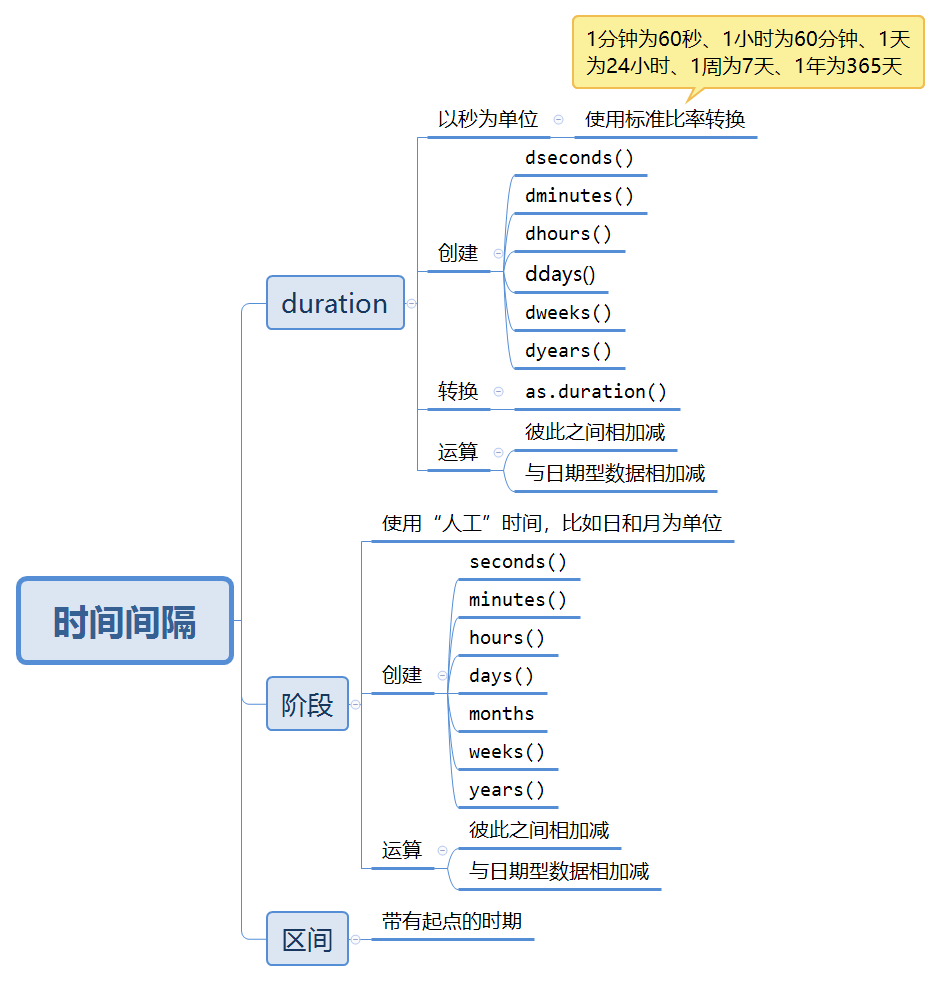
如果只关心物理时间,那么就使用时期;如果还需要考虑人工时间,那么就使用阶段;如果需要找出人工时间范围内有多长的时间间隔,那么就使用区间。
13.4 时区
在R中,时区是日期时间型数据的一个属性,仅用于控制输出,不会影响具体的时刻。
改变时区的两种方法:
保持时间不变,修改其显示方式:
with_tz修改内部时间:
force_tz